

Live Chat Now
→
Send an Email
→
Call Us
→
Error!

Every industry is impacted by the digital revolution. As more connected devices enter the market and the internet of things grows, business not only becomes more mobile but also more intelligent. Organizations have already seen how the digital age can streamline internal communications and allow for remote office locations to function more in tandem with the central hub.
However, the advantages of the digital transformation extend far past these speed increases. Companies have access to more data now than ever before. If their infrastructure is optimized to process this information, it can mean the transformation from gut-driven best guesses to data-backed and logical decision-making.
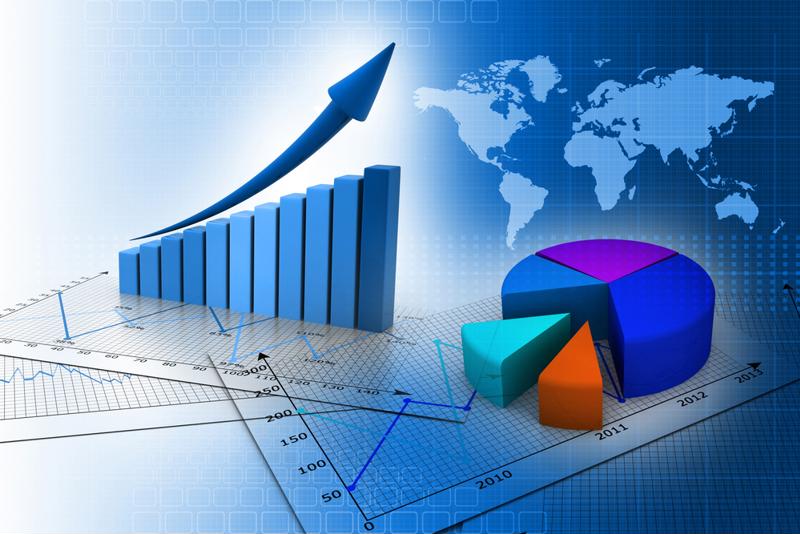
What is data visualization and how does it work?
Data visualization is a process of communication that focuses primarily on the construction and study of pictorial information. Enterprises have been using this technique for decades, with common forms including line graphs and pie charts. Data visualization is effective because of how quickly the human brain can process its information. According to research from MIT, the mind can process and understand an image in roughly 13 milliseconds. This is, of course, infinitely quicker than reading a full report.
However, before the digital transformation, data visualization had to be manually created. Once employees harvested the data, it had to be physically entered into a program to produce said graphs.
While productive, this process is open to human error and fails in the face of the new big data possible from the IoT. It can also be time-consuming to make and populate these charts, depriving analysts of time that could be better spent studying and interpreting the data.
New technologies such as machine learning and artificial intelligence have made reliable, auto-generating data visualization programs a possibility - but not every company is equipped to take advantage.
Why does data visualization matter to competitive companies
With consumer expectations on the rise, organizations are hard-pressed to deliver a quality product in an acceptable time frame. It has been traditional business practice that companies react to the market - and those at the top have faster/more effective reactions than their competition. However, the window to make decisions is shrinking and executives need to have relevant and complete information in order to make sound judgments.
Traditional enterprise operations have prided employee intuition and snap decisions. However, this model of thinking must change going forward for businesses to remain competitive. As Murli Buluswar, chief science officer, AIG, told McKinsey:
"The biggest challenge of making the evolution from a knowing culture to a learning culture—from a culture that largely depends on heuristics in decision making to a culture that is much more objective and data driven and embraces the power of data and technology—is really not the cost. Initially, it largely ends up being imagination and inertia."
Buluswar's comments reference the impatience of enterprise space when it comes to seeing results. When companies implement new data visualization software, they often do not make the internal adjustments necessary to fully capitalize on the new platform. Traditional corporate infrastructure segments information: Every department is divided up, with employees from different branches rarely speaking to one another or sharing data. This can greatly hinder data visualization software's performance in gathering information.
For instance, if a television network has three independent call centers that each keep their own archives, that data is not being regularly pooled together. Likewise, the R&D department, responsible for overseeing product improvements and innovation, does not have reliable access to the customer experience data - which can help identify pain points and easy upgrade opportunities.
For organizations to fully use new data visualization tools, information barriers must be brought down and corporate infrastructure made more agile. As consumer expectations continue to increase, industry leaders will need fast, complete data that is immediately actionable.

How network strength affects data visualization
Data visualization, and to a large extent data analytics in general, requires a strong network connection present within an organization. Information must be transmitted reliably and consistently to generate real-time reports. This is especially important for companies gathering data from remote locations. Frequently disrupted network connections can lead to lost data and incomplete reports.
As organizations look to modernize their infrastructure for the 21st century, Perle has the hardware and expertise to assist this effort. Our company provides essential technology, such as media converters, extenders and signal switches, all of which are designed to extend and improve network strength. Contact Perle today to learn how we can help outfit your company into a modern firm that is ready to utilize cutting edge technology like these new data visualization tools.
